SOLD ! boomed the auctioneer.
Another property down.
Next one up.
The buyers beamed.
So did the sellers.
The buyers don't know it yet, but they will do very well out of their purchase. Thank you very much. I'm not sure the neighbours will appreciate the new owner's future intentions. How would you feel if your new neighbours sub-divided their property into 200m2 lots? (courtesy of the Mixed Housing Suburban Zone (MHSZ) under the Unitary Plan)......more....
Get your Free Online Property Appraisal...here
"These properties have now sold. More needed." - Tim Golder
I took a gander at the Unitary Plan the other day. Some of it you may know. Some you may not. Did you know, for instance, that in a single house zone (land area: 600m2), you can subdivide the existing footprint of your house into two dwellings? Or that you can apply to use your land for panel-beating and motor mechanic shops?
Wondering where you stand with your property? You have come to the right place. Because all the hard work has been done for you. This 'one-stop', 'easy-to-use', information pack gives you the opportunity to identify on a map - not only your zone under the proposed Unitary Plan - but also the future zones for your general neighbourhood. It also shows what you can do with your land - and what other property owners can do with their land - when the proposed Unitary Plan comes into effect.
It is easy to do; just match the colours on the map with a legend, and presto, you have all the information at your fingertips to make use of the activity table below.
So lets get started. In minute I am going to give you a link to open a map in a new window. When the new window (map) opens, click on the button at the bottom of the page for access to the interactive map. You can then type your address into the black search window on the right hand side of the screen. After you do that, push the 'Enter' button on your keyboard. The screen will then enlarge and your property will be the one with the pin on it (if the pin cannot be seen, move the two small black windows to one side).
Take note of the colour of your property (land/section) on the map, and match it to one of the colours in the legend immediately below. This allows you to identify your future zone - and your rights to develop your property - under the proposed Unitary Plan.
The interactive unitary plan map can be found by clicking
here...
This is the legend to use with the map
Now, this is the interesting bit: once you know your proposed zone, you can look at the Activity Table below to see what you and your neighbours can do with your property in the future. An explanation of the abbreviations (P, D, RD, NC) in the table, can be found at the bottom of the page.
Get your Free Online Property Appraisal...here
This is the Activity Table KEY
P = Permitted
D = Discretionary
NC = Non-Complying
RD = Restricted Descretionary
(Explanation about the above key can be found at the end of this article)
Sheet1
.
Activity
Large Lot zone
Single House zone
Mixed Housing Suburban zone
Mixed Housing Urban zone
Terrace Housing and Apartment Buildings zone
.
Residential
.
Camping grounds
NC
NC
NC
NC
NC
.
Dwellings
P
P
P (up to 3 dwellings per site)
P (up to 3 dwellings per site)
P (one dwelling per site)
.
RD (4 or more dwellings per site)
RD (4 or more dwellings per site)
D (2 to 4 dwellings per site)
.
RD (5 or more dwellings per site)
.
Home occupations
P
P
P
P
P
.
Retirement villages
NC
D
D
D
D
.
Supported residential care and boarding houses up to 200m² GFA per site
NC
P
P
P
P
.
Supported residential care and boarding houses not provided for above
NC
D
D
D
D
.
Visitor accommodation up to 200m² GFA per site
NC
RD
RD
RD
RD
.
Visitor accommodation not provided for above
NC
D
D
D
D
.
Commerce
.
Dairies up to 100m2 GFA per site
NC
D
RD
RD
RD
.
Restaurants and cafes up to 100m² GFA per site
NC
NC
NC
D
RD
.
Service stations on arterial roads
NC
D
D
D
D
.
Community
.
Care centres up to 200m² GFA per site
P
P
P
P
P
.
Care centres between 200m² - 400m² GFA per site
NC
RD
RD
RD
RD
.
Care centres not provided for above
NC
D
D
D
D
.
Community facilities
D
D
D
D
D
.
Education facilities
NC
D
D
D
D
.
Emergency services on arterial road
NC
D
D
D
D
.
Healthcare facilities up to 200m² GFA per site
NC
RD
RD
RD
RD
.
Healthcare facilities and associated buildings not provided for above
NC
NC
D
D
D
.
Rural
.
Grazing of livestock on sites greater than 2,000m2 net site area
P
NC
NC
NC
NC
.
Mana Whenua
.
Marae complex
D
D
D
D
D
.
Development
.
Alterations and additions to a single dwelling on a site
P
P
P
P
P
.
Alterations and additions to two or more dwellings on a site
P
P
P
P
RD
.
Demolition of buildings
P
P
P
P
P
.
The conversion of a dwelling into a maximum of two dwellings complying with the land use controls in clause 3.3 below
RD
P
P
P
D
.
Buildings accessory to the permitted and restricted discretionary non-residential activities listed above
RD
RD
RD
RD
RD
.
Buildings accessory to all other activities listed in this table have the same activity status as the activity itself.
The following explanation about the abbreviations used in the above table comes from the Auckland Council.
The Resource Management Act (RMA) classifies activities into the following types:
Permitted activities (P)
Resource consent is not required for a permitted activity if it complies with all the relevant rules in the Unitary Plan. The Unitary Plan uses this approach to provide for activities to be carried out as of right, provided certain controls are met. If an activity does not comply with one or more of the relevant controls it is not a permitted activity.
Restricted discretionary activities (RD)
Resource consent is required for a restricted discretionary activity. Council may approve
or decline a proposal for a restricted discretionary activity. The Unitary Plan specifies the
matters over which council has restricted its discretion. Council's consideration of the
proposal, and the ability to refuse the application and impose conditions, is restricted to
these matters.
Discretionary activities (D)
Resource consent is required for a discretionary activity. Council may approve or
decline a proposal for a discretionary activity. In assessing the proposed activity, council
can consider all relevant objectives and policies within the Unitary Plan, all potential
environmental effects, and any matters outlined in s. 104 of the RMA without limitation in
decision-making.
Non-complying activities (NC)
Resource consent is required for a non-complying activity. Council may grant or refuse
the application. There are extra tests under the RMA, which council must consider when
assessing a non-complying activity.
There are two types of non-complying activities in the Unitary Plan:
listed activities that are specifically identified as non-complying
activities which default to non-complying status because they are not specifically
provided for as permitted, controlled, restricted discretionary or discretionary.
Rule: Any activity not specifically identified in the Unitary Plan as permitted, controlled,
restricted discretionary, discretionary or prohibited is a non-complying activity.
Get your Free Online Property Appraisal...Here Sales Statistics for the Whole of The Bays and beyond Found....Here
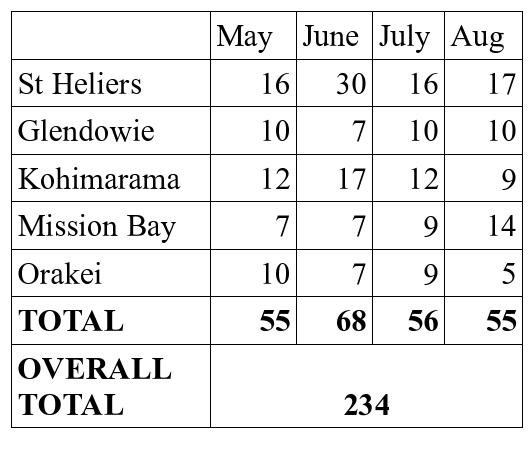
234 properties have sold in St Heliers, Glendowie, Kohimarama, Mission Bay, and Orakei from the start of May to the end of August. The 'quick-glance' chart below offers a breakdown between the suburbs and the number of properties that have sold during that period. September sale numbers have not been included as they are not yet on the public domain. But, using Barfoot and Thompson St Heliers branch office as a guide to the number of properties that have sold this month, it is fair to say they make attractive reading.
While we cannot comment on the numerous other real estate companies, it is a fact that Barfoot and Thompson St Heliers have been selling close to a property a day for the past 4 months. It is also a fact that we have been selling more properties than getting new listings coming onto the market. Currently our biggest challenge is finding more properties to sell.
You can imagine the number of frustrated buyers we have. Anecdotally, there are increasing numbers of buyers going through open homes in The Bays. That means more buyer competition and better prices. Of course the current small number of properties for sale on the market increases a seller's likelihood of a sale because of the buyer's reduced choice. Buyers also enjoy the advantage of low interest rates which economists generally agree are safe for now.
This raises the prospect of house inflation (we have already seen price increases in food, petrol, rates, insurance etc). As business journalist, Jenny Ruth points out: Goldman Sachs economist Philip Borkin recently commented that Alan Bollard, the governor of the Reserve Bank, has acknowledged the domestic economy is improving and inflation risks remain. Infometrics economist Gareth Keirnan predicts housing prices will rise 5.6% by the end of next year. BNZ economist Stephen Toplis mentions there is a real risk of under-supply and excess demand.
Of course some may argue, “we are buying and selling in the same market so inflation won't make a difference”. Well that statement is true in a stable market. But it ignores the difference between price and cost when inflation hits. Price represents your property value. If inflation forces property prices up, your property value must also increase.
Cost represents the pain you experience when you buy another property. Cost is particularly relevant when salary and wages lag behind inflation. In a nutshell, even though property values (price) increase in line with inflation, salary and wages fall behind.
What does this mean for you? Assuming economists are correct about rising inflation, alonside the price vrs cost distinction, buying a property next year will be more painful than buying one now – even when you take buying and selling in that same market into consideration.
So, should you sell now? Yes if you play the market to your advantage: enjoy selling well now (less competition from other sellers and more opportunity to attract high-paying buyers), then pick up a good buy with summer just around the corner when traditionally more properties come onto the market - before inflation and increased mortgage rates take place next year.
Tim Golder has been away since March and is now back. He can be contacted on (027) 298 0309 and he looks forward to working with you again.
The media (TV, radio, print) have published clear-cut evidence listings are down and buyers are out. Demand has begun to outstrip supply. Increasingly, it now looks like a sellers market for quality properties across St Heliers, Glendowie, Kohimarama, Mission Bay, and Orakei.
Further evidence comes from Alistair Helm, the CEO of New Zealand's largest dedicated real estate website (realestate.co.nz). He reports inventory has dropped, property is selling more quickly, and adds prices have remained more or less stable overall.
A more accurate picture is found by isolating out suburbs in The Bays. Zoodle, a subsidiary of realestate.co.nz, shows healthy real estate price growth as at June 2011 for St Heliers (5%), Glendowie (12.3%), and Mission Bay (8.6%). Falls have been recorded in Orakei (-6.6%) and Kohimarama (-12.1%). Want to know how much your house is worth without seeing a real estate agent?....Free Online Property Appraisal....Make sure you see this one.
If Barfoot and Thompson's recent statistical trend - continual drop in the number of properties coming onto the market (6053 in February vrs 4830 in July) - continues, buyers may come under even more pressure to pay more across Auckland.
Furthermore, Tony Alexander's (BNZ economist) accurate commentary over time about an insufficient number of houses being built, exacerbates the problem of reducing housing stock for sale.
Of course the recent economic turmoil in Europe and America makes things more volatile. If it settles down, it is likely Reserve Bank moves will lift mortgage rates to the buyers detriment. If so, any sensible buyer will be looking to cement in rates while they can.
At the moment it is not likely mortgage rates will go up if the turmoil continues - but mortgage rate increases are still a possibility. Rates could rise due to the cost of raising funds internationally by banks at roll-over time regardless of the Reserve Bank's Official Cash Rate (OCR). At the moment mortgage rates are low and buyers want to buy. Ever wondered how much a property sold for in your area of interest? Now you can see for free. Sales Statistics....Be sure to have a read.
Given more property is selling than coming onto the market, it is a great time for sellers to take action: the fewer the properties on the market, the less the competition from other sellers. The less choice a buyer has to buy, the more opportunity the seller has to sell.
In a nutshell, if you are thinking of selling, sell now to take advantage of the lack of competition and low mortgage rates while you can.
The median sale price for property in St Heliers, Glendowie, Kohimarama, Mission Bay, and Orakei was 7% higher in January-February 2011 than the same period in 2010. This means buyers would have to save an extra $52,000 over the previous 12 months to be in the same place they were in last year. Fine if buyers earn big money. Not so good for the average buyer who seeks to live in The Bays. Want to know how much your house is worth without seeing a real estate agent?....Free Online Property Appraisal....Make sure you see this one.
To place this price growth into perspective, buyers who purchase property today will pay approximately $75 more per week in mortgage repayments compared to buyers who purchased property a year ago ( mortgage 5.7% floating rate).
Moreover, extrapolating the median sale price from now to January-February 2012, (assuming a continued 7% growth) would yield the following result: median price $824,000, weekly mortgage $1189. This means buyers next year will pay $78 more per week in mortgage repayments than today's buyers, and $153 more per week than buyers last year.
However, in spite of the increased median sale price, property prices will not rocket away any time soon. Consumers are still reducing debt and facing increasing living costs in the form of accommodation, fuel , food, utilities and so forth. Nevertheless, statistics indicate property prices have bottomed out in The Bays and are slowly marching upwards. Ever wondered how much a property sold for in your area of interest? Now you can see for free. Sales Statistics....Be sure to have a read.
Quite apart from statistical evidence, it is generally accepted the growing shortage of property must also force prices higher. This has been brought into sharp relief recently with rental increases. The temperature is now about to go up as the summit for Auckland's future announced Auckland will need to house an extra one million people within the next 30 years. Add to this the numbers of people heading our way to escape the carnage of Christchurch and perhaps Japan. So the question is, given that construction is falling behind and supplying houses is not cheap, where do you see house prices going?
As an aside, if you are curious about what the American Central Intelligence Agency (CIA) have to say about NZ's economy, take look at their website here
Sales for St Heliers, Glendowie, Kohimarama, Mission Bay, and Orakei slowed over January. As you would expect. After all January is a prime holiday period. February however seems to have started the month determined to kick January for touch. Buyers are back and they are determined to buy. Want to know how much your house is worth without seeing a real estate agent?....Free Online Property Appraisal....Make sure you see this one.
Some interesting points of note
Some buyers have started to realise that this is 2011 and the revised Capital Values are due out this year. Some buyers have been hopeful that capital values will stay the same. Others have been a bit more realistic: “I don't remember capital values ever going down”, to quote one buyer. You would have to agree
Another pattern which has only started to peep over the parapet are plaster homes starting to sell for pretty close to the capital value if not for a bit more. Admittedly plaster homes still take longer to sell but the fact the sales prices have begun to more closely match capital values is good news for monolithic home owners. It also supports statistics in previous posts that prices in The Bays must be creeping up
Rents are on the move. They are now pretty high in sought after suburbs and will likely go even higher. It is good news for property prices because it improves yield (return on the dollar invested) for investors and encourages renters to become buyers. When renters become buyers – and some definitely will - this will swell the buyers ranks, increase buyer competition, enhance demand, and encourage property prices upwards
Commodity prices have moved up. Dairy farmers for example, have had good payouts and this will have a flow-on effect to the economy generally of which real estate forms a big part.
On the flipside, the Christchurch earthquake will undoubtedly dampen the economic recovery. Christchurch makes up 15% of Gross Domestic Product (GDP) and that represents a lot of taxes the Inland Revenue will not collect for some time to come (due to loss of profit and income from productive businesses and their employees). Additionally, the people of Christchurch will need government assistance to get them back on their feet and the money has to come from somewhere.
Recently there has been talk from economists about the Reserve Bank reducing the Official Cash Rate (OCR) in response to the Christchurch earthquake to give the economy a further kickstart. Reducing the OCR will promote inflation. From a real estate perspective, this means prices go higher and buyers pay more.
In a rising market sellers pay more than they got for the sale of their own property just to get a home equal to the one they sold. Of course the best time to sell is on a downward moving market because the next property the seller buys will be bigger and better and bought for less.
However statistics indicate the downward trend in The Bays has bottomed out and prices have started to rise. So if you are an owner thinking of upsizing, downsizing, or moving to a particular type of property or a particular area, you may like to think about reducing the loss and enjoying the profit by moving now. Ever wondered how much a property sold for in your area of interest? Now you can see for free. Sales Statistics....Be sure to have a read.
You may remember reading in the October 2010 post titled 'Property Prices At A Glance' that Orakei looked to be performing well compared to St Heliers, Glendowie, Kohimarama, and Mission Bay. As can be seen in the following graph, Orakei continues to perform and is the outright winner in median price growth over the previous 4 months. Want to know how much your house is worth without seeing a real estate agent?....Free Online Property Appraisal....Make sure you see this one.
The other winners are St Heliers and Kohimarama. Though prices in both these suburbs remain stable with a slight tilt upwards in the curve, median prices could lift further in St Heliers and Kohimarama because of improving sale numbers in each of these localities.
Glendowie is the only suburb where both median prices and sales numbers (found in previous report below) have fallen. Part of the reason for the drop in the number of sales in Glendowie is the low number of properties (currently 33) for sale in the area. The drop in price to some extent can be explained by fewer higher priced properties coming onto the market.
The same could be said for Mission Bay which has also seen a drop in median property prices. Mission Bay is also similar to Glendowie in having a low number of properties for sale (currently 38). Unlike Glendowie however, the number of properties successfully sold in Mission Bay continue to rise. If this trend continues then increasing sales reflect increasing demand. Demand creates buyer competition. Competition increases price. Ever wondered how much a property sold for in your area of interest? Now you can see for free. Sales Statistics....Be sure to have a read.
The following two charts have been included for you to very quickly gain an insight into median property prices (both overall and by the number of bedrooms a house has), sale numbers, and price ranges in your area of interest.
In a nutshell, property prices in The Bays have a reasonable likelihood of holding firm. Further support comes from economists largely agreeing that rents will likely increase over the course of 2011, mortgage interest rates will remain low in the median term, and there is a growing shortfall of properties to soak up Auckland's growth. To take the phrase uttered by the New Zealand Institute of Economic Research Chief economist, Shamubeel Eaqub, to Alistair Helm, the CEO of realestate.co.nz: “fundamentals [will catch up] with house prices rather than house prices crashing to meet the fundamentals”. That is good news for The Bays.
Over the course of the year various media reports have mentioned the number of property sales in New Zealand has been in decline. Fortunately property owners in most of the suburbs in The Bays have had a better fate: as can be seen from the graph below, St Heliers, Mission Bay, and Orakei have all seen a lift in sales throughout 2010. Want to know how much your house is worth without seeing a real estate agent?....Free Online Property Appraisal....Make sure you see this one.
As can be seen from the following graphs, Kohimarama and Glendowie have trended down and may represent good buying opportunities.Ever wondered how much a property sold for in your area of interest? Now you can see for free.Sales Statistics....Be sure to have a read.
The following two charts are updates of the median prices for suburbs in The Bays from the chart presented two months ago. Comparing the charts with the charts in my previous post indicates prices have largely remained stable.
Taking the charts and graphs together may reflect smart buyers have recognised that any over-valued prices have already corrected and that it is wise to act now before prices begin to lift. They are also aware that the added advantage of benefiting from current low mortgage rates will change. Once mortgage rates move up it is entirely feasible a number of buyers may not be able to afford to buy a property that they can afford now.
Though the economy is still tight, media reports indicate economists agree they can see improvement – albeit slowly. People are still paying down debt and the retail sector is still sluggish but the unemployment rates have come down and that means more people are getting more money in their pocket to spend. Auckland continues to grow from both international and internal migration but new houses have not been built to cater for the future demand and that means there continues to be a growing shortage of property. The turning point can't be too far away.
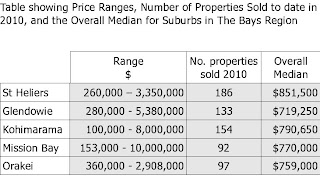
This report calculates the median prices for suburbs such as St Heliers, Glendowie, Kohimarama, Mission Bay, and Orakei. It includes the median price for property according to the number of bedrooms as well as giving an overview of the number of properties that have been sold in the area.The value of your property may be below, equal to, or more than the median prices reported here depending on land size, construction integrity, presentation, floorplan, and so forth. Want to know how much your house is worth without seeing a real estate agent?....Free Online Property Appraisal....Make sure you see this one.
Comparing the median sale prices in the previous table with the overall median sale price in the following table, clearly illustrates most of the sales have taken place in the $600000 - $900000 range over 2010. Ever wondered how much a property sold for in your area of interest? Now you can see for free.Sales Statistics....Be sure to have a read.
Given St Heliers has the highest overall median value, it is more likely more people will invest more money buying a property in St Heliers than other suburbs. Nevertheless the most expensive properties have been sold in Mission Bay, Kohimarama, and Glendowie. Orakei prices continue to do well.
Want to know if we have buyers for your property? We've just started a list of buyers page.You might as well have a look at the list of buyers while you are here... More buyers coming.
Feel free to pass this site's address around. timgolder.co.nz has great information for all your friends.
Remember:http:/www.timgolder.co.nz must be typed into the address bar to get to the page.
Ever wondered how much a property sold for in your area? Now you can see for free. Sales Statistics....Be sure to have a read.
Want to know how much your house is worth without seeing a real estate agent?.... Online Appraisal....Make sure you see this one. It is FREE!
Want to know if we have buyers for your property? We've just started a list of buyers page.You might as well have a look at the list of buyers while you are here... More buyers coming.
Want a mortgage calculator. We've got that as well. Check it out.
School Zones? It's all here.
Feel free to pass this site's address around. timgolder.co.nz has great information for all your friends.
Remember:http:/www.timgolder.co.nz must be typed into the address bar to get to the page.


 The other winners are St Heliers and Kohimarama. Though prices in both these suburbs remain stable with a slight tilt upwards in the curve, median prices could lift further in St Heliers and Kohimarama because of improving sale numbers in each of these localities.

 In a nutshell, property prices in The Bays have a reasonable likelihood of holding firm. Further support comes from economists largely agreeing that rents will likely increase over the course of 2011, mortgage interest rates will remain low in the median term, and there is a growing shortfall of properties to soak up Auckland's growth. To take the phrase uttered by the New Zealand Institute of Economic Research Chief economist, Shamubeel Eaqub, to Alistair Helm, the CEO of realestate.co.nz: “fundamentals [will catch up] with house prices rather than house prices crashing to meet the fundamentals”. That is good news for The Bays.


